


Photo Credit: noina / Shutterstock
For the first two years of the pandemic, the shifting landscape around COVID-19 affected travel more than almost any sector of the economy. Concerns about the spread of the virus and changes in travel restrictions and public health guidance led many would-be travelers to hold off on trips. As a result, industries like air travel and lodging saw much lower than usual demand throughout 2020 and 2021, and closely related businesses like restaurants and arts, entertainment, and recreation facilities also suffered. But according to recent data from the U.S. Travel Association, many indicators like hotel room demand and overall travel spending are at or near pre-pandemic levels.
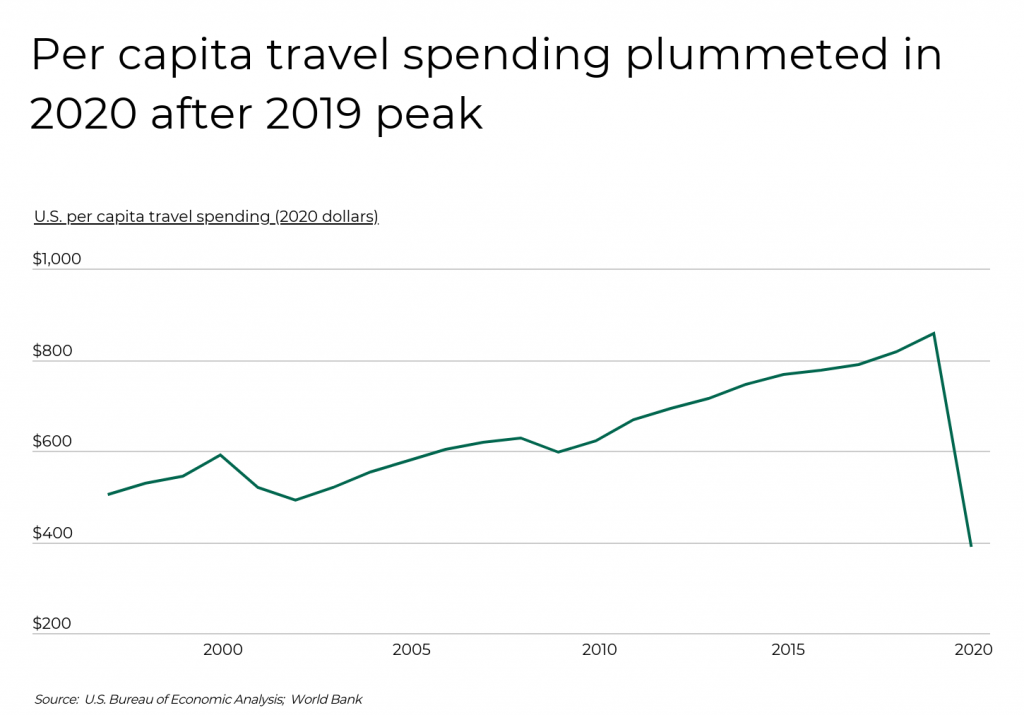
A recovery in travel spending would be welcome news given the dramatic drop brought on by COVID-19. The onset of the pandemic in 2020 sharply reversed an upward trend in travel spending over more than two decades. From 1997 to 2019, annual per capita travel spending—defined as the summation of air transportation and accommodations spending—increased from $504 to $856 in inflation-adjusted dollars. Over that span, spending only declined in the two years following the September 11 attacks, which produced a decline in air travel, and from 2008 to 2009 with the onset of the Great Recession. But from 2019 to 2020, the pandemic set off a historic drop of almost 55% in travel spending, to just $388 per capita.
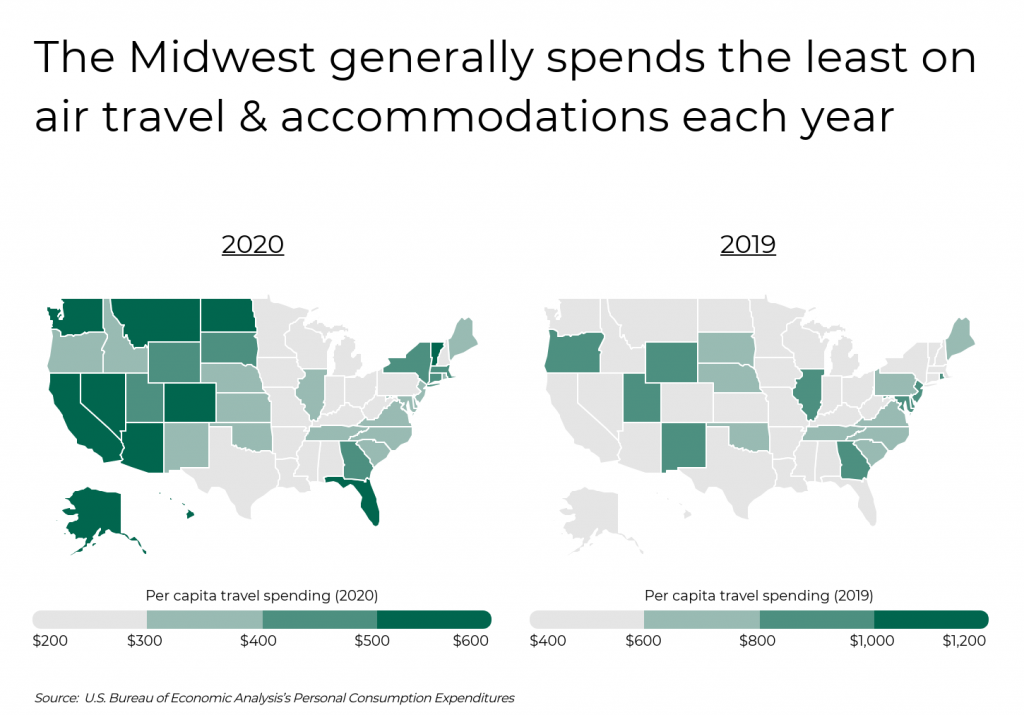
But the rapid drop in travel spending played out differently across the country based on varying geographic trends in spending on air travel and accommodations. For example, residents of the Midwest and parts of the South tended to be the lowest spenders on travel in both 2019 and 2020, which may be a product of lower incomes in these regions. Other states like Alaska and Hawaii—which are more costly to travel to and from due to geography—were among top spenders in both years but saw significant declines in dollars spent.
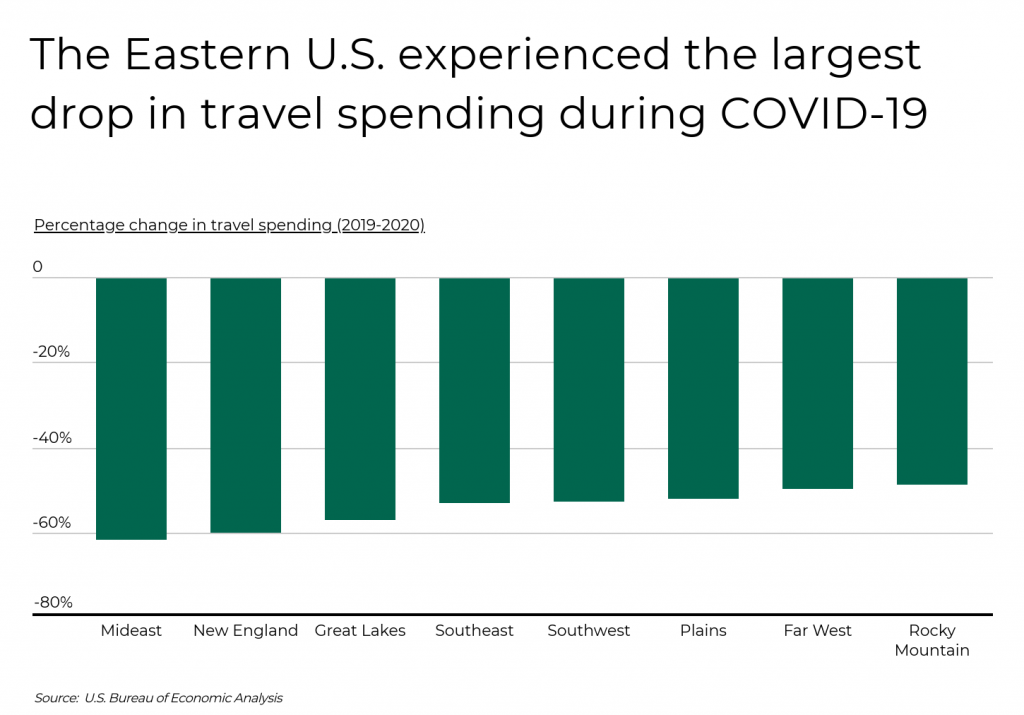
By percentages, however, the greatest drops in travel spending were in the Mideast (-61.4%) and New England (-59.8%) regions. Some of these locations were hard-hit early in the pandemic, with severe early outbreaks in locations like the New York and Boston metros that may have discouraged travel. Many Northeastern states were also among the most stringent in terms of public health restrictions like testing or quarantine requirements for travelers entering or returning to the state. All of these factors reduced interest (and spending) on travel from states in these regions. In contrast, states in the interior of the U.S., including the Plains (-51.7%), Far West (-49.5%), and Rocky Mountain (-48.5%) regions saw lower declines in travel spending from 2019 to 2020.
The data used in this analysis is from the U.S. Bureau of Economic Analysis’s Personal Consumption Expenditures. To determine the states with the biggest drop in travel spending during COVID, researchers at Filterbuy calculated the percentage change in air transportation and accommodations spending from 2019 to 2020. In the event of a tie, the state with the greater total change in air transportation and accommodations spending from 2019 to 2020 was ranked higher.
Here are the states with the biggest drop in travel spending during COVID.
States With the Biggest Drop in Travel Spending During COVID

Photo Credit: Sean Pavone / Shutterstock
15. Michigan
- Percentage change in travel spending (2019-2020): -56.1%
- Total change in travel spending (2019-2020): -$3,083,300,000
- Per capita travel spending (2020): $242
- Per capita travel spending (2019): $550

Photo Credit: Bob Pool / Shutterstock
14. Oregon
- Percentage change in travel spending (2019-2020): -56.3%
- Total change in travel spending (2019-2020): -$2,019,100,000
- Per capita travel spending (2020): $369
- Per capita travel spending (2019): $850
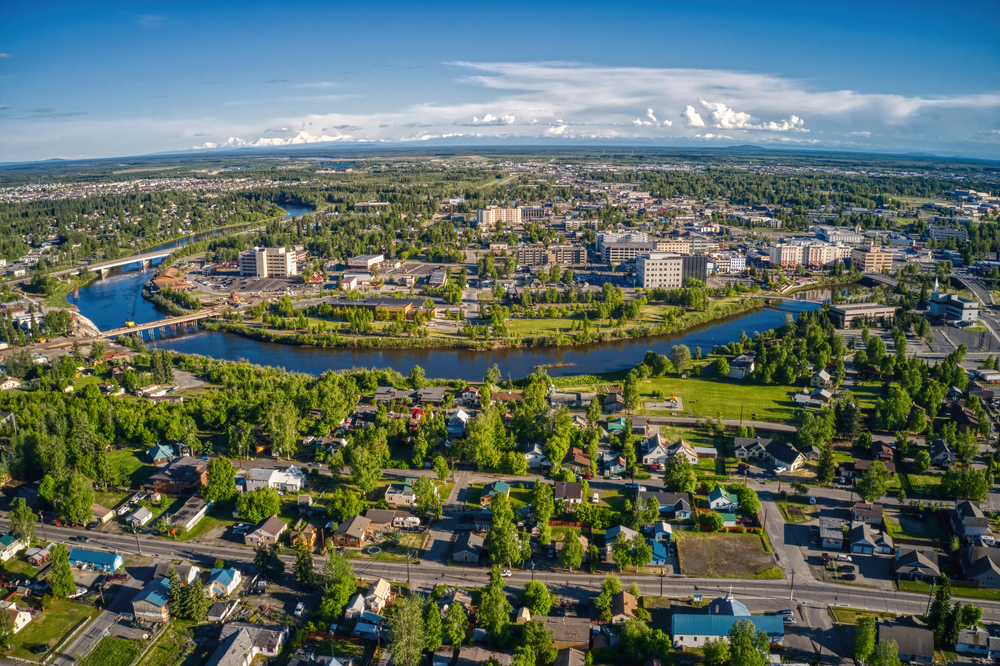
Photo Credit: Jacob Boomsma / Shutterstock
13. Alaska
- Percentage change in travel spending (2019-2020): -56.5%
- Total change in travel spending (2019-2020): -$572,500,000
- Per capita travel spending (2020): $603
- Per capita travel spending (2019): $1,385

Photo Credit: f11photo / Shutterstock
12. Maryland
- Percentage change in travel spending (2019-2020): -56.8%
- Total change in travel spending (2019-2020): -$2,876,200,000
- Per capita travel spending (2020): $361
- Per capita travel spending (2019): $838

Photo Credit: ESB Professional / Shutterstock
11. Georgia
- Percentage change in travel spending (2019-2020): -56.8%
- Total change in travel spending (2019-2020): -$5,658,600,000
- Per capita travel spending (2020): $402
- Per capita travel spending (2019): $939

Photo Credit: Checubus / Shutterstock
10. Minnesota
- Percentage change in travel spending (2019-2020): -57.3%
- Total change in travel spending (2019-2020): -$1,751,400,000
- Per capita travel spending (2020): $230
- Per capita travel spending (2019): $542

Photo Credit: Jeremy Janus / Shutterstock
9. Washington
- Percentage change in travel spending (2019-2020): -57.4%
- Total change in travel spending (2019-2020): -$5,375,100,000
- Per capita travel spending (2020): $519
- Per capita travel spending (2019): $1,230

Photo Credit: Felix Mizioznikov / Shutterstock
8. Virginia
- Percentage change in travel spending (2019-2020): -58.4%
- Total change in travel spending (2019-2020): -$3,757,900,000
- Per capita travel spending (2020): $311
- Per capita travel spending (2019): $754
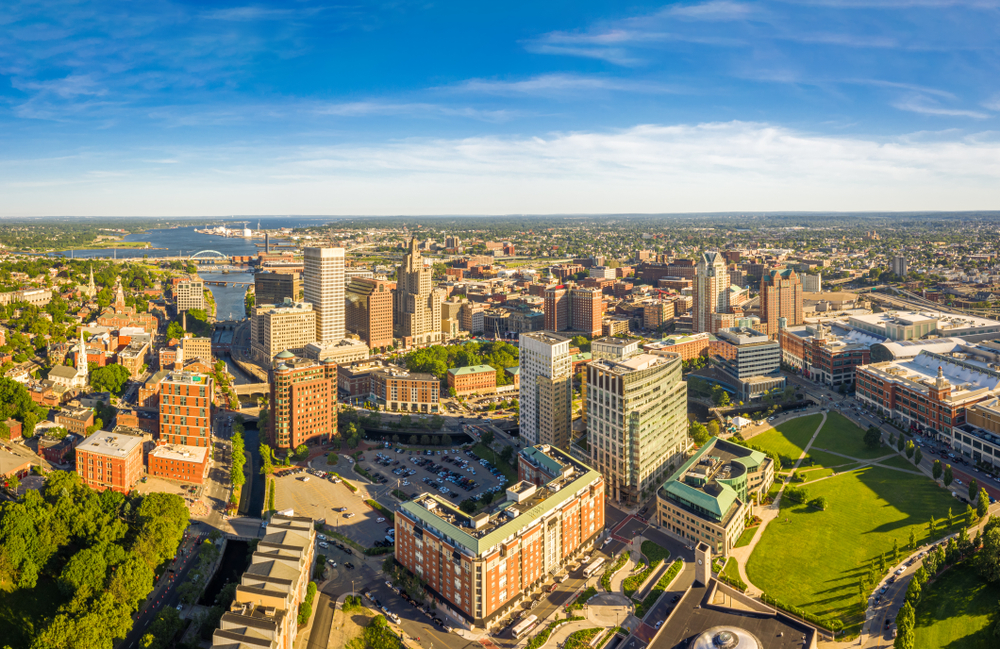
Photo Credit: Mihai_Andritoiu / Shutterstock
7. Rhode Island
- Percentage change in travel spending (2019-2020): -58.9%
- Total change in travel spending (2019-2020): -$555,300,000
- Per capita travel spending (2020): $366
- Per capita travel spending (2019): $890

Photo Credit: Henryk Sadura / Shutterstock
6. New Jersey
- Percentage change in travel spending (2019-2020): -58.9%
- Total change in travel spending (2019-2020): -$4,263,100,000
- Per capita travel spending (2020): $334
- Per capita travel spending (2019): $814

Photo Credit: Gang Liu / Shutterstock
5. Pennsylvania
- Percentage change in travel spending (2019-2020): -59.2%
- Total change in travel spending (2019-2020): -$4,770,200,000
- Per capita travel spending (2020): $258
- Per capita travel spending (2019): $630

Photo Credit: Oleg Podzorov / Shutterstock
4. Illinois
- Percentage change in travel spending (2019-2020): -60.0%
- Total change in travel spending (2019-2020): -$7,281,100,000
- Per capita travel spending (2020): $385
- Per capita travel spending (2019): $957

Photo Credit: Wendell Guy / Shutterstock
3. Connecticut
- Percentage change in travel spending (2019-2020): -60.5%
- Total change in travel spending (2019-2020): -$2,426,500,000
- Per capita travel spending (2020): $446
- Per capita travel spending (2019): $1,125

Photo Credit: eskystudio / Shutterstock
2. Massachusetts
- Percentage change in travel spending (2019-2020): -61.8%
- Total change in travel spending (2019-2020): -$5,216,300,000
- Per capita travel spending (2020): $467
- Per capita travel spending (2019): $1,224

Photo Credit: Victor Moussa / Shutterstock
1. New York
- Percentage change in travel spending (2019-2020): -64.2%
- Total change in travel spending (2019-2020): -$14,195,700,000
- Per capita travel spending (2020): $409
- Per capita travel spending (2019): $1,136
Detailed Findings & Methodology
The data used in this analysis is from the U.S. Bureau of Economic Analysis’s Personal Consumption Expenditures. To determine the states with the biggest drop in travel spending during COVID, researchers calculated the percentage change in air transportation and accommodations spending from 2019 to 2020. In the event of a tie, the state with the greater total change in air transportation and accommodations spending from 2019 to 2020 was ranked higher.