


The rise in mortgage rates beginning in 2022 has placed significant financial pressure on American households, reshaping the housing landscape. While some homeowners locked in historically low rates during the pandemic era, today’s elevated borrowing costs have made it much more challenging for new buyers to enter the market or for existing homeowners to refinance. For those with adjustable-rate mortgages or those nearing the end of fixed-rate periods, the financial strain has intensified as monthly payments rise sharply.
Homeowners who have fully paid off their homes are in a stronger financial position to weather periods of economic uncertainty and elevated rates. According to Census Bureau data, while approximately 63% of homeowners aged 65 and over have fully paid off their homes, less than 28% of working-age homeowners (under 65) have done so. This leaves a substantial portion of the working population vulnerable to financial stress, especially during times of high interest rates and inflationary pressures.
Home Value and Housing Costs for Homeowners by Mortgage Status
Homeowners with mortgages have higher home values, incomes, and housing costs
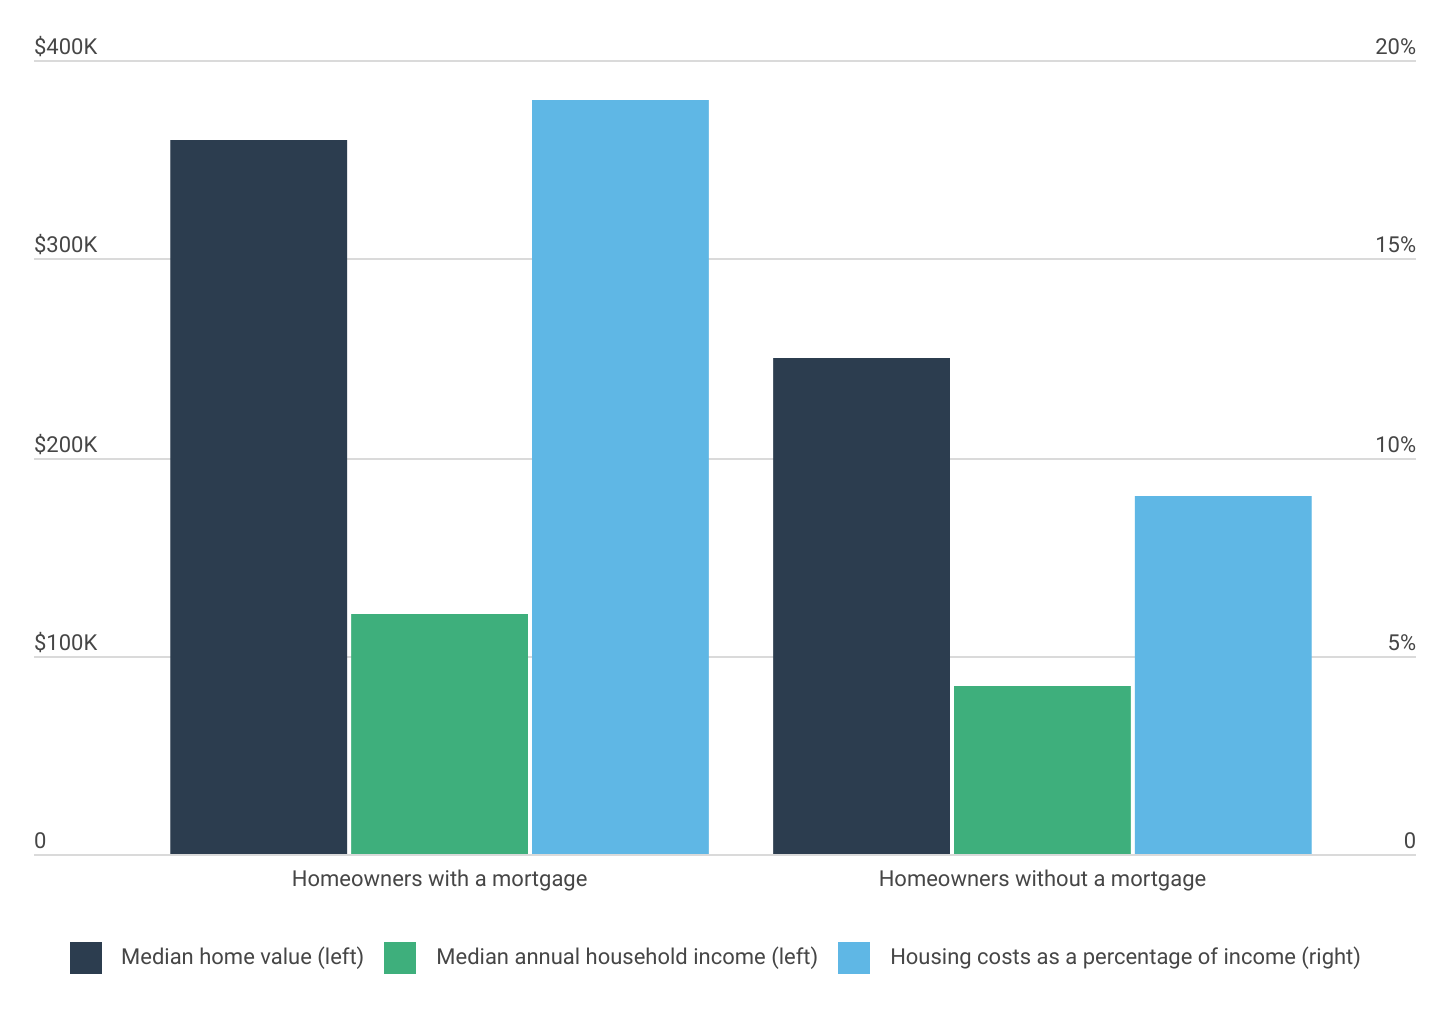
Source: Construction Coverage analysis of U.S. Census Bureau data | Image Credit: Construction Coverage
When focusing on working-age homeowners, those with mortgages tend to have higher home values and incomes compared to those who have fully paid off their homes. This challenges the assumption that mortgage-free homeowners are necessarily more affluent or financially successful.
Homeowners with a mortgage report a median home value of $360,000, significantly higher than the $250,000 median value for homes owned outright. Similarly, households with a mortgage have a median annual income of $121,000, compared to just over $85,000 for those without a mortgage. Consequently, median housing costs as a percentage of income—including mortgage payments, insurance, utilities, and other home-related expenses—amount to 19% for homeowners with a mortgage, compared to just 9% for their mortgage-free counterparts.
These figures suggest that mortgage-free homeowners under 65 may prioritize financial stability over owning higher-value properties, may have transitioned to less expensive homes after paying off their debt, or may have inherited their properties. The disparity in home values and incomes also reflects broader housing market dynamics, where higher incomes typically enable buyers to qualify for larger loans, often resulting in the purchase of more expensive homes.
Percentage of Homes Owned Free & Clear by State
Southern states have the most residents who have paid off their homes
Source: Construction Coverage analysis of U.S. Census Bureau data | Image Credit: Construction Coverage
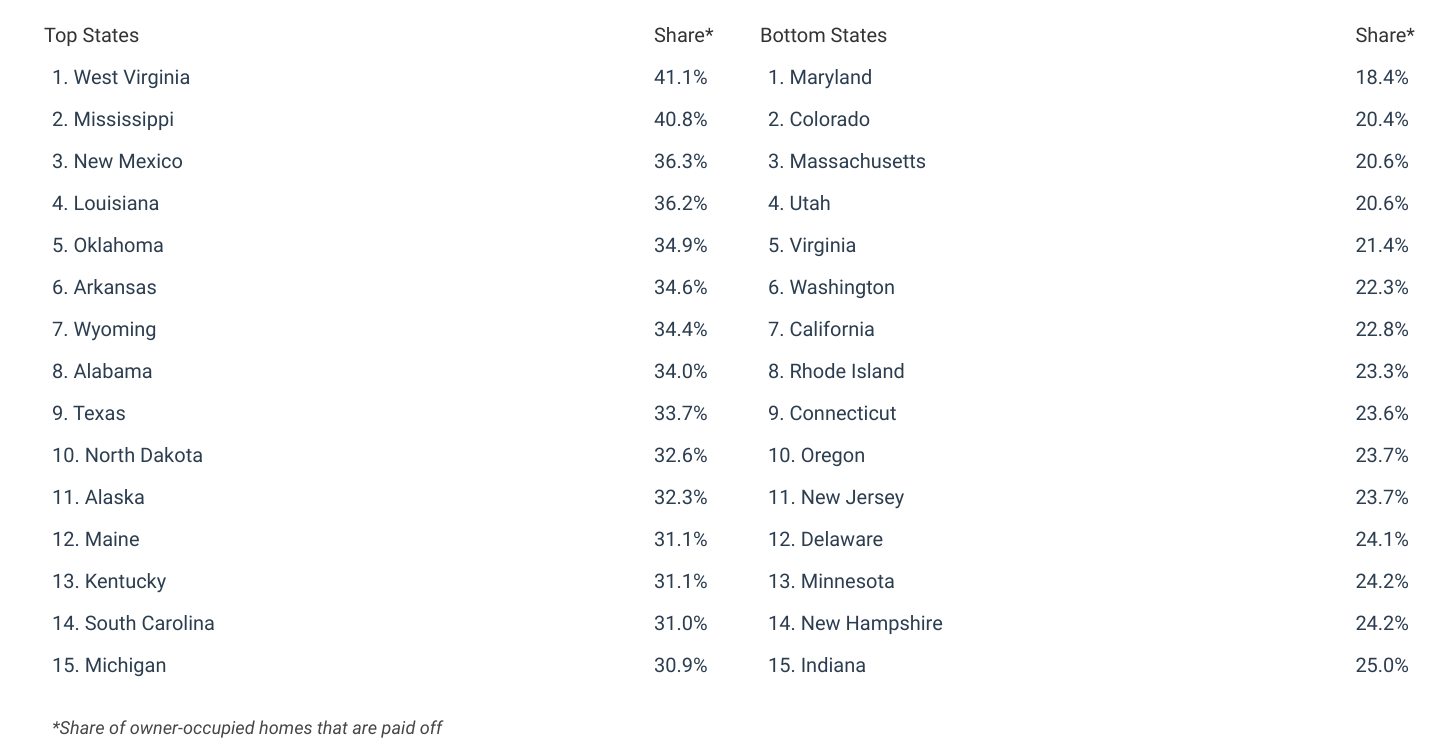
Mortgage payoff rates vary substantially across the country. While at the national level, the share of homeowners under age 65 who have paid off their homes is 27.7%, not all areas have equal rates of free-and-clear homeownership. Being mortgage-free is strongly negatively correlated with both household income and home value, so certain states in the South like West Virginia (41.1%), Mississippi (40.8%), and Louisiana (36.2%), all have shares of owner-occupied homes that are paid off above 35%.
At the other end of the spectrum, Maryland has the lowest rate of owner-occupied homes that are paid off at 18.4%. Other states with low rates of free-and-clear homeownership among the working-age population include high-home-price states Colorado (20.4%), Massachusetts (20.6%), and Utah (20.6%).
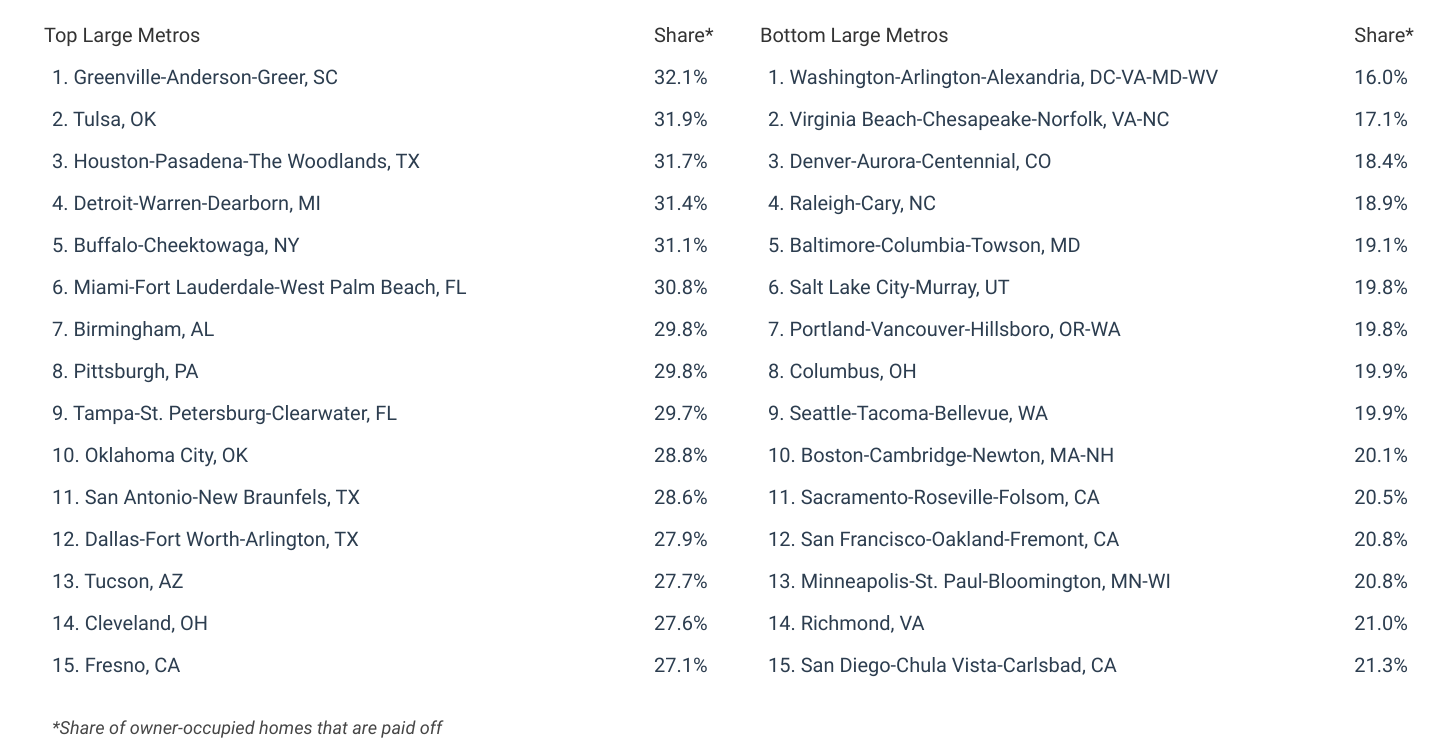
At the metropolitan level, nine out of the top 15 large metros for free-and-clear homeownership are found in the South—led by Greenville, SC at 32.1%. Conversely, more expensive coastal cities and desirable locations in the Mountain West—such as Washington, DC (16.0%) and Denver, CO (18.4%)—have the lowest share of owner-occupied homes that are paid off.
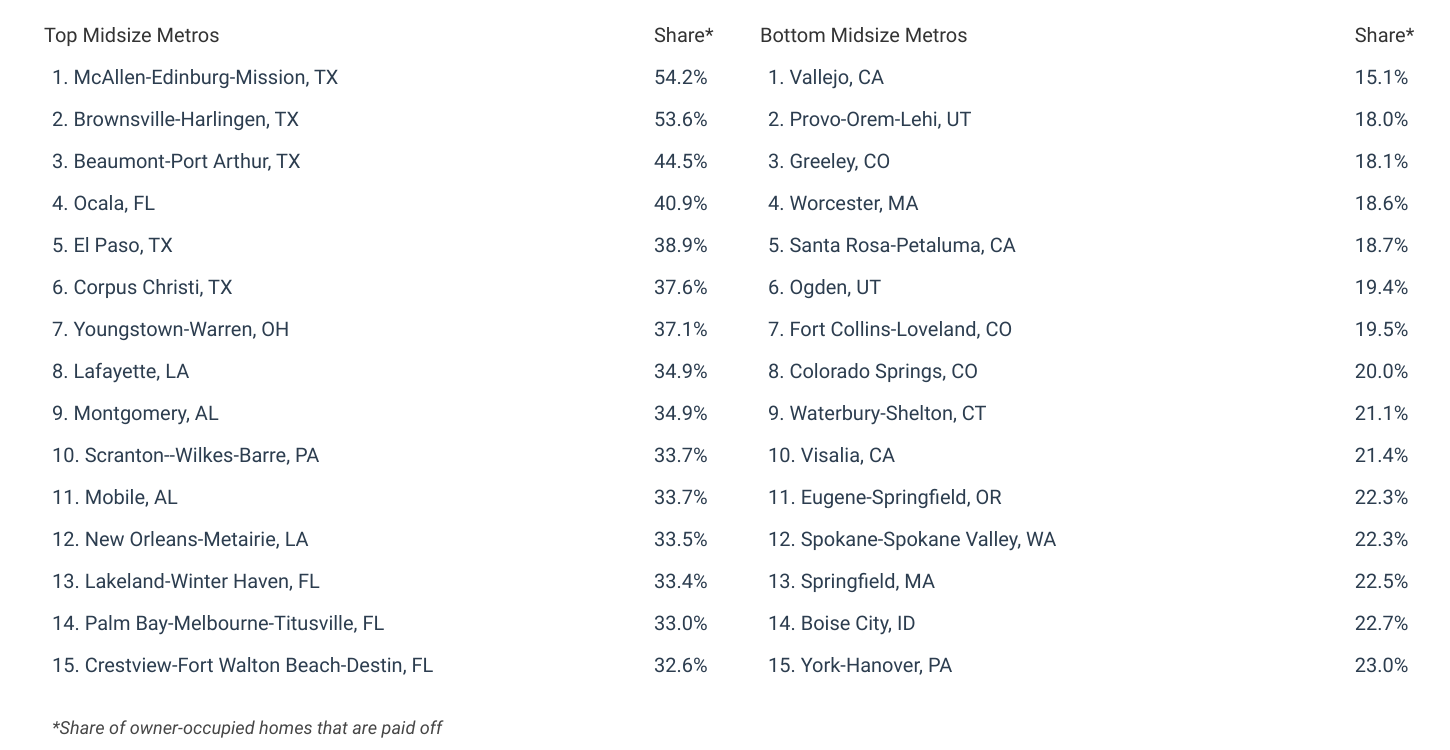
Below is a breakdown of working-age residents who have paid off their homes for the top and bottom U.S. metros and states. The analysis was conducted by researchers at Construction Coverage, a website that compares construction software and insurance, using data from the U.S. Census Bureau. For complete results, see the full report on Construction Coverage: Cities With the Most Working-Age Residents Who Have Paid off Their Homes.
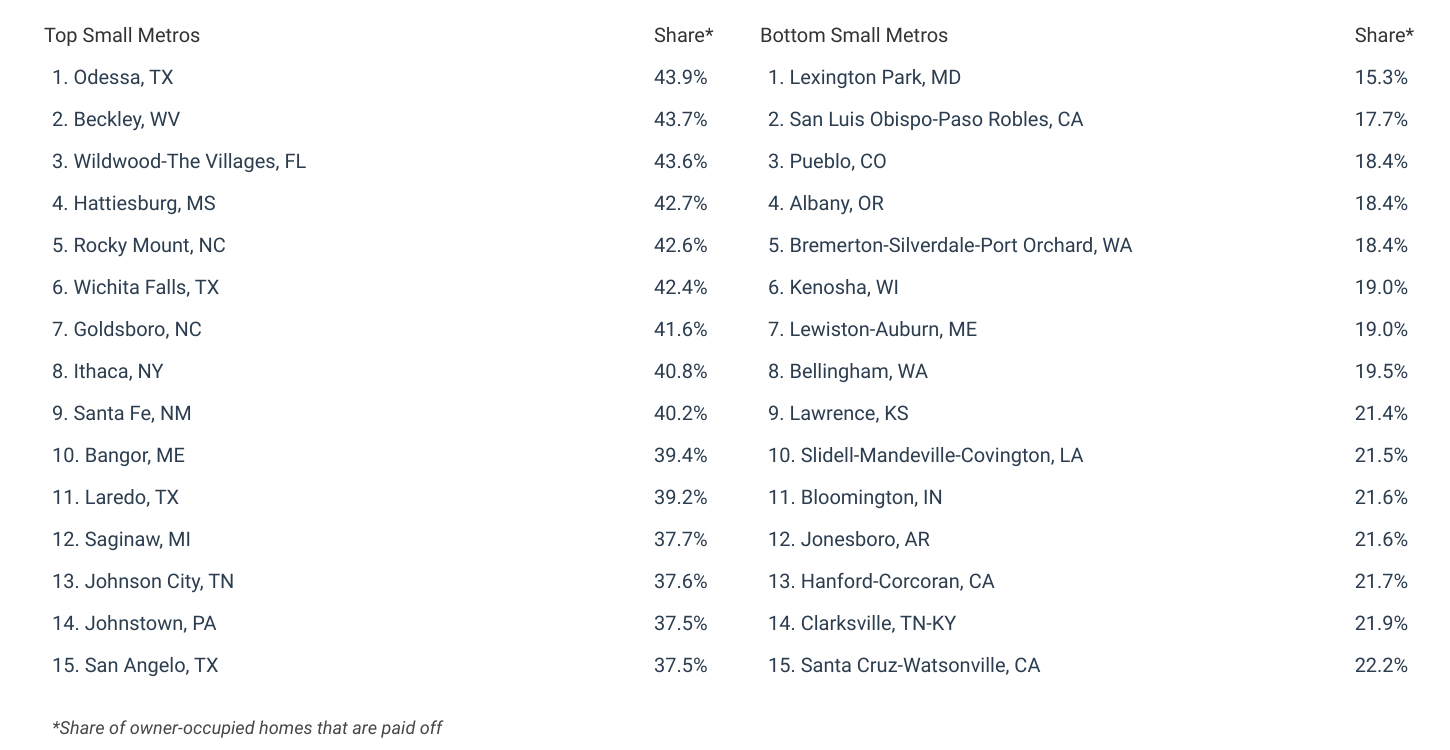
Cities With the Most Residents Who Have Paid off Their Homes
States With the Most Residents Who Have Paid off Their Homes
Methodology

Photo Credit: Romakoma / Shutterstock
The data used in this study is from the U.S. Census Bureau’s American Community Survey 2023 1-Year Estimates. To determine the locations with the most residents who have paid off their homes, researchers at Construction Coverage ranked locations by the share of owner-occupied households without a mortgage (owned “free and clear”). For relevance, only owner-occupied households with positive income and a working-age primary householder (under the age of 65) were considered.
To improve relevance only metropolitan areas with complete data were included. Additionally, metros were grouped into cohorts based on population: small (under 350,000), midsize (350,000–999,999), and large (1,000,000 or more).
For complete results, see Cities With the Most Working-Age Residents Who Have Paid off Their Homes on Construction Coverage.