While the beginning of the COVID-19 pandemic was a time that many industries would soon like to forget, demand for plumbers and other local contractors reached all-time highs.
Homeowners, finding themselves with more time indoors, embarked on renovation projects and essential maintenance tasks, elevating the need for skilled tradespeople. This surge in demand came at a time when various building trades were already contending with labor shortages. The result was a strong upward pressure on wages for those skilled trade workers who remained in the labor force.
Demand for Plumbers in Context
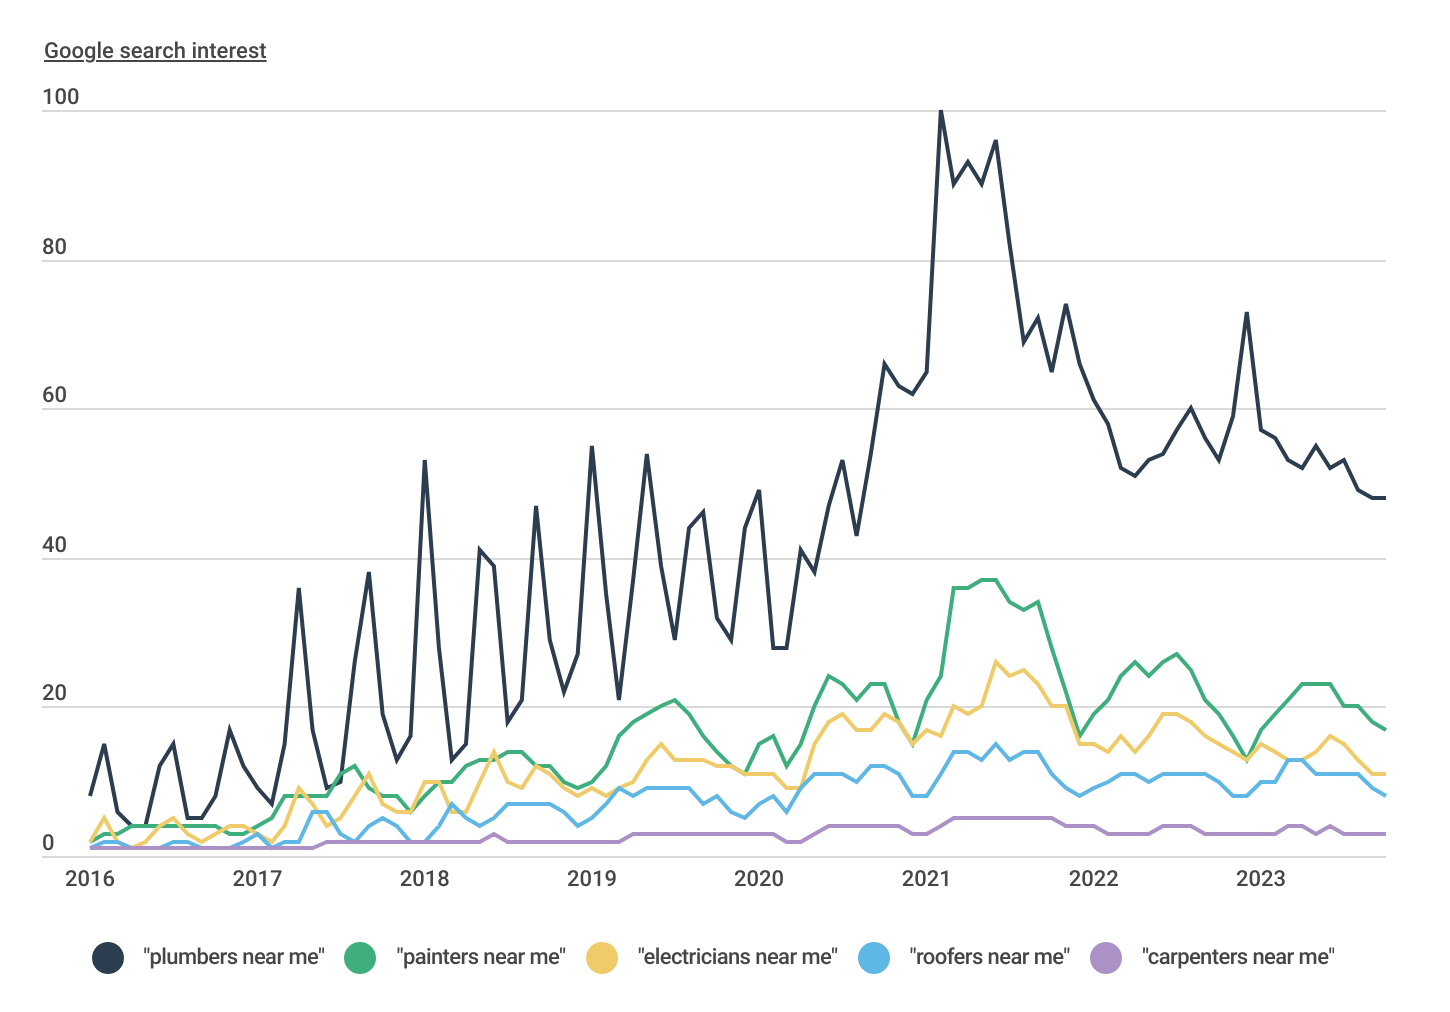
Demand for plumbers has subsided following a historic spike during COVID-19
Source: Construction Coverage analysis of Google Trends data | Image Credit: Construction Coverage
According to internet search data from Google, demand for local contractors rose sharply in 2020, peaked in early 2021, and began to decline as rising interest rates curtailed construction projects. Despite this, current levels of online searches for local contractors still remain above pre-pandemic levels.
The demand for plumbing contractors in particular is about twice as high as that of the next closest building trade—a fact due to plumbing’s critical role not only in new construction but also in small remodels, ongoing maintenance, and emergency repairs. Additionally, as water conservation programs become increasingly important in certain parts of the country, homeowners are turning to plumbers for expertise in upgrading to more efficient systems.
As one of the most in-demand building trades, plumbing could be an appealing field of work. As with many service jobs, becoming a plumber doesn’t require a college degree. Rather, individuals can enroll in affordable trade schools or participate in an apprenticeship to sharpen their skill set. The typical plumber makes $60,090 annually, according to data from the Bureau of Labor Statistics (BLS), and the field will grow by 2% by 2032. That growth will open up nearly 11,000 new plumbing jobs in the next nine years.
Geographic Differences in Plumbers’ Pay
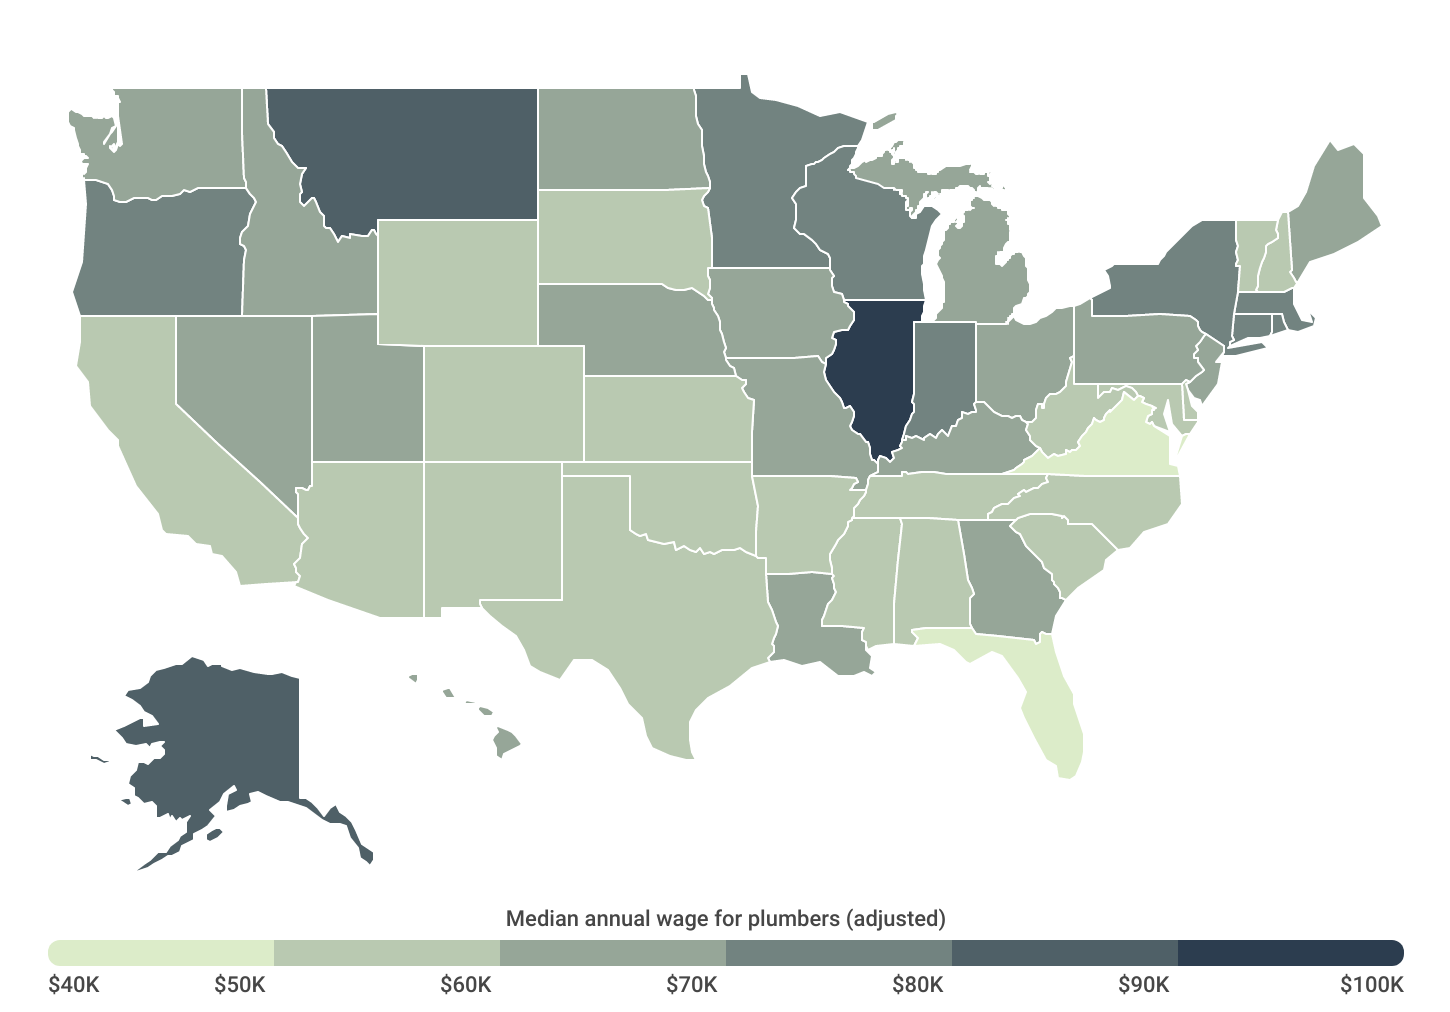
Illinois boasts the strongest cost-of-living-adjusted wages for plumbers
Source: Construction Coverage analysis of U.S. Bureau of Labor Statistics data | Image Credit: Construction Coverage
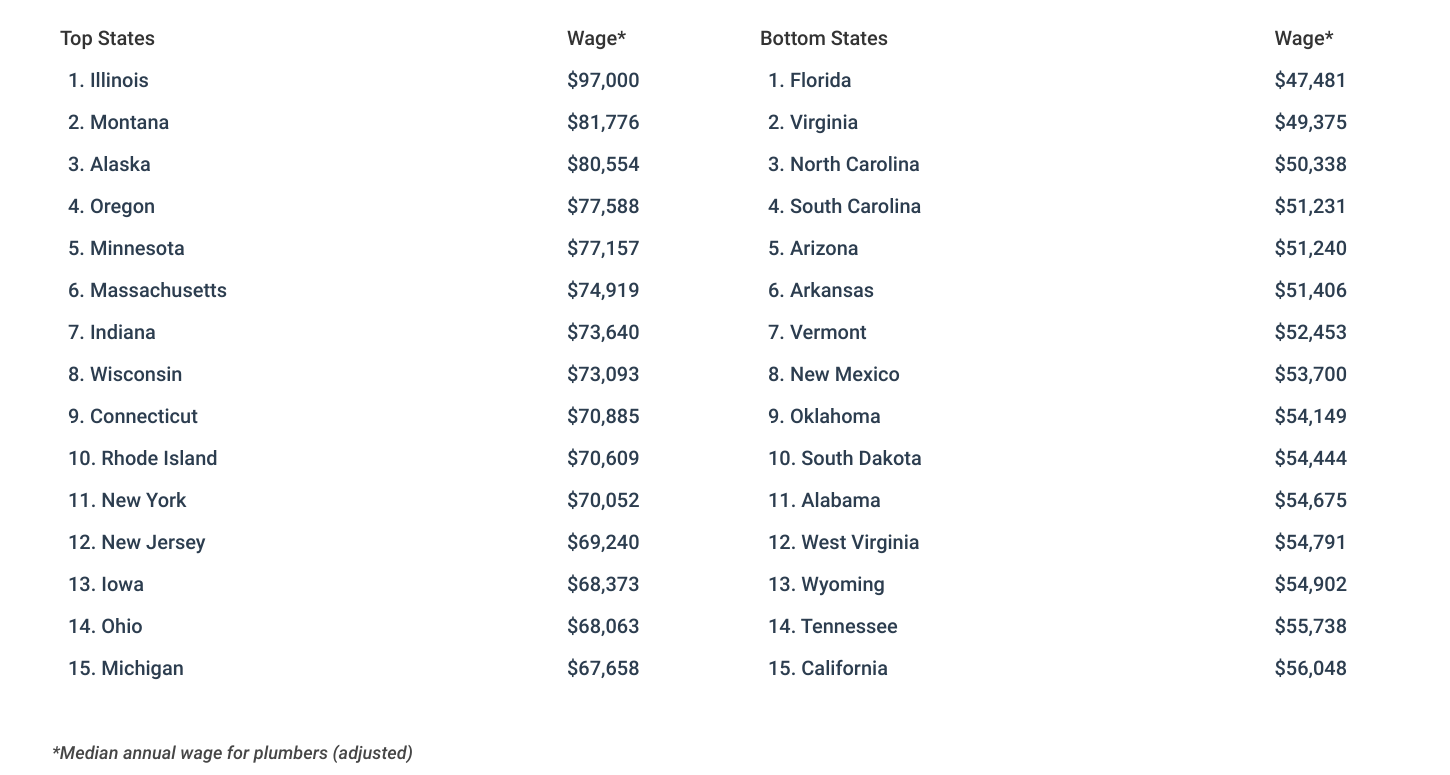
On a national scale, plumbers earn about 30% more than the typical worker, according to data from the BLS. And while the national-level data indicates that being a plumber provides above-average pay, state-level data shows a highly regional industry where plumbers in the northern half of the U.S. make far more than their southern counterparts.
After adjusting for the cost of living, Illinois ($97,000), Montana ($81,776), Alaska ($80,554), Oregon ($77,588), and Minnesota ($77,157) are the top five states with the highest median annual wages for plumbers. These states stand in stark contrast to the states with the lowest adjusted wages: Florida ($47,481) and Virginia ($49,375). The disparity between the top and bottom states is so great that adjusted yearly pay for plumbers in Illinois is more than Florida and Virginia combined.
Similar trends hold at the local level, with many metropolitan areas in Illinois and Minnesota ranking highly for plumbers’ wages. In the top metros, the typical plumber can expect to make over $100,000 per year. In general, the locations with the best pay for plumbers are more likely to have high unionization rates and reasonable living costs.
Below is a complete breakdown of plumber wage and employment statistics for all major U.S. metropolitan areas and all 50 states. The analysis was conducted by Construction Coverage using data from the U.S. Bureau of Labor Statistics and the U.S. Bureau of Economic Analysis.
Best- and Worst-Paying Large Metros for Plumbers
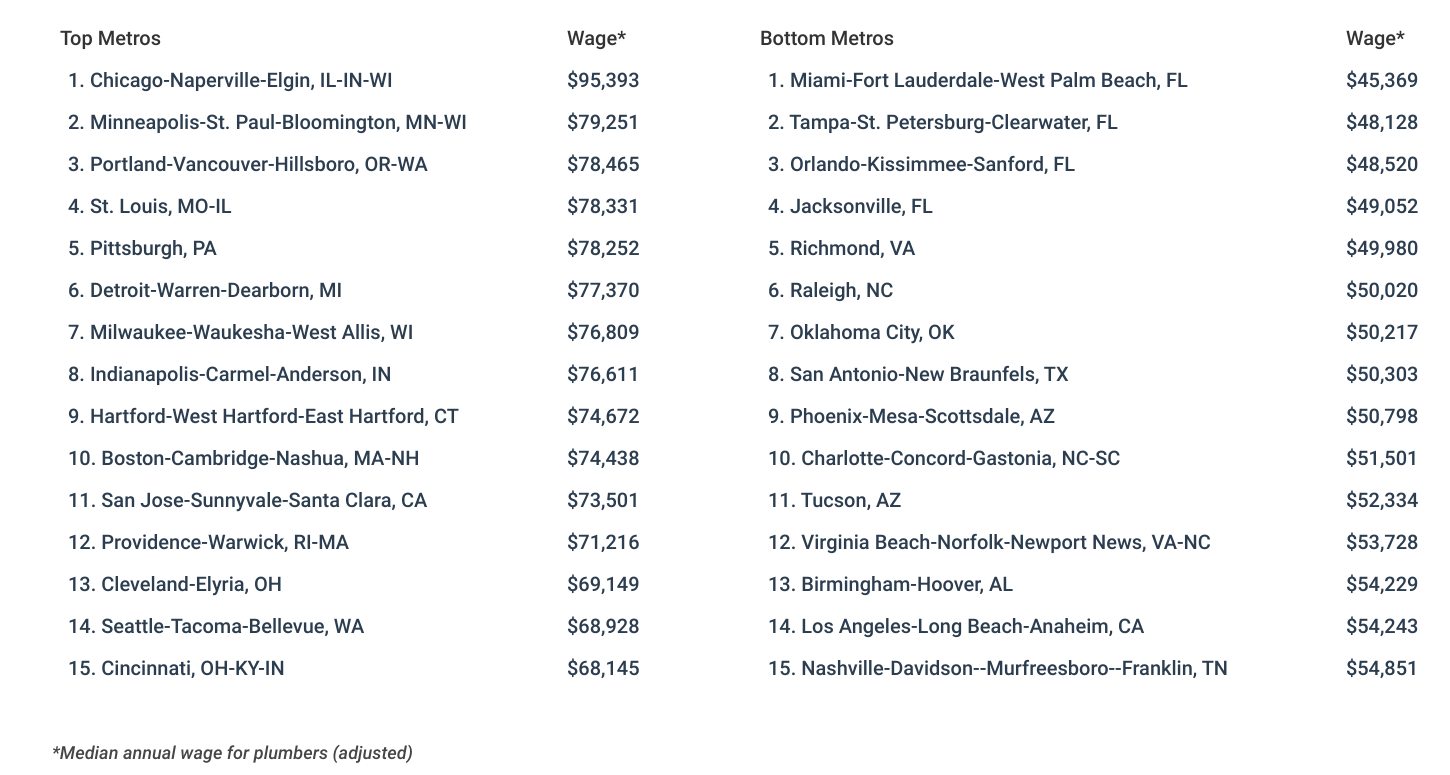
Best- and Worst-Paying Midsize Metros for Plumbers
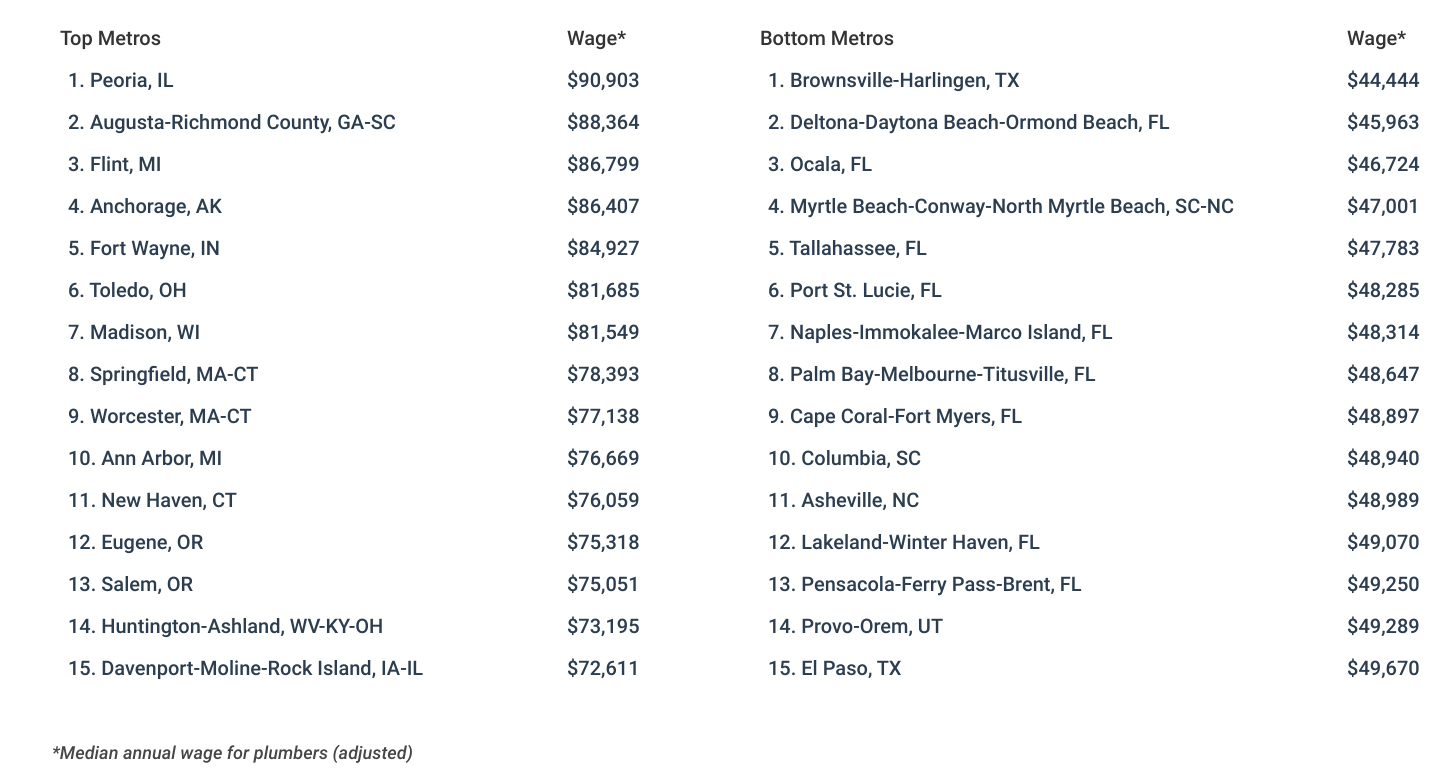
Best- and Worst-Paying Small Metros for Plumbers
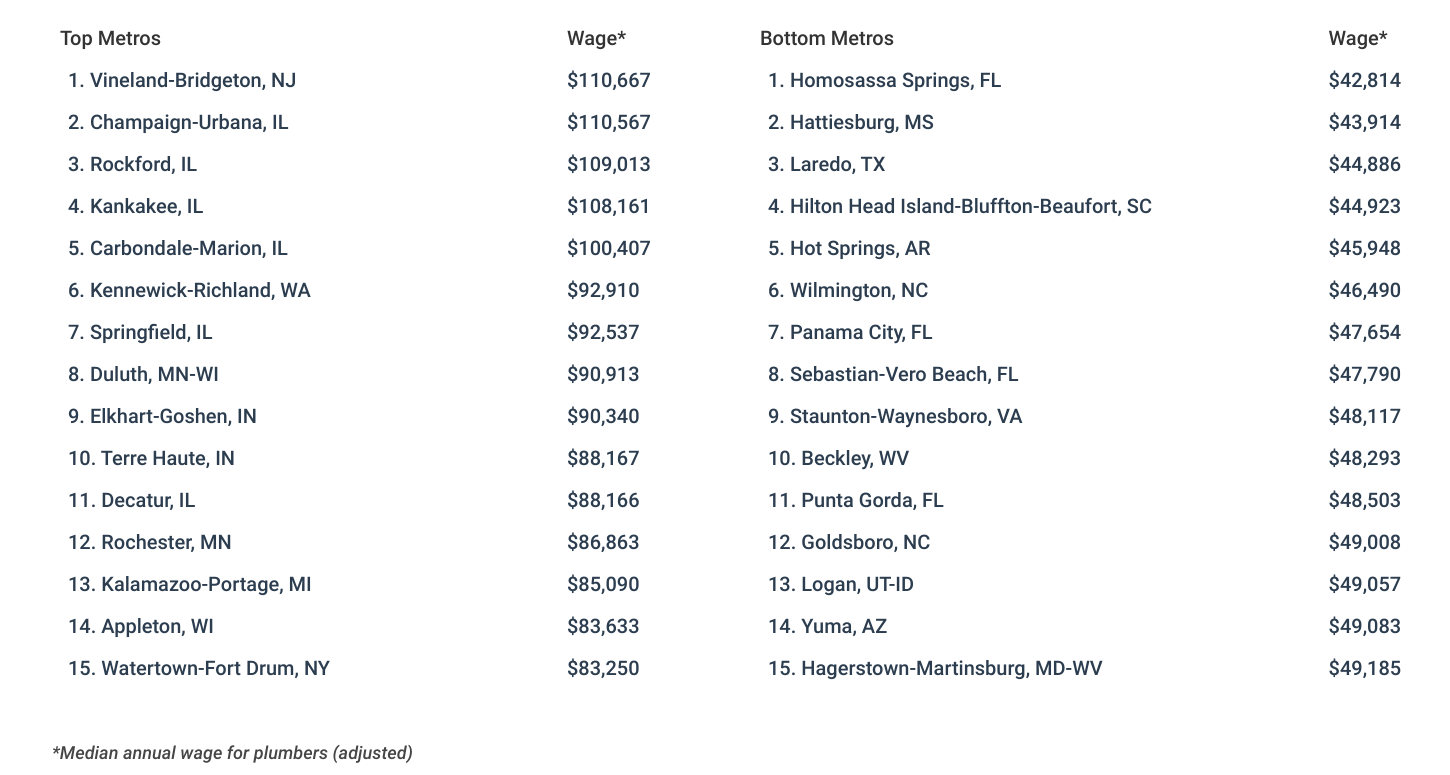
Best- and Worst-Paying States for Plumbers
Methodology

Photo Credit: Dagmara_K / Shutterstock
To find the best-paying locations for plumbers, researchers at Construction Coverage used wage and employment data from the U.S. Bureau of Labor Statistics (BLS) 2022 Occupational Employment and Wage Statistics (OEWS) program and cost-of-living data from the U.S. Bureau of Economic Analysis (BEA) 2022 Regional Price Parities dataset.
For each location, the median annual wage for plumbers was adjusted according to the relative cost of living. In locations with higher living costs, wages were adjusted down to reflect lower purchasing power, while wages in locations with lower living costs were adjusted up to reflect greater purchasing power. Researchers also calculated the relative concentration of plumbers in each location, which is the location’s percentage difference from the national concentration (measured as the total number of plumbers divided by the total number of workers across all occupations).
Only locations with at least 100,000 people and available data from both the BLS and BEA were included in the analysis. Additionally, metropolitan areas were grouped into cohorts based on population size: small (100,000–349,999), midsize (350,000–999,999), and large (1,000,000 or more).
For complete results, see The Best-Paying Cities for Plumbers on Construction Coverage.


